
Where do my rates go?
The council's Annual Plan 2025/26 outlines what the council is spending, where, and why.
You can find the latest Annual Plan here.
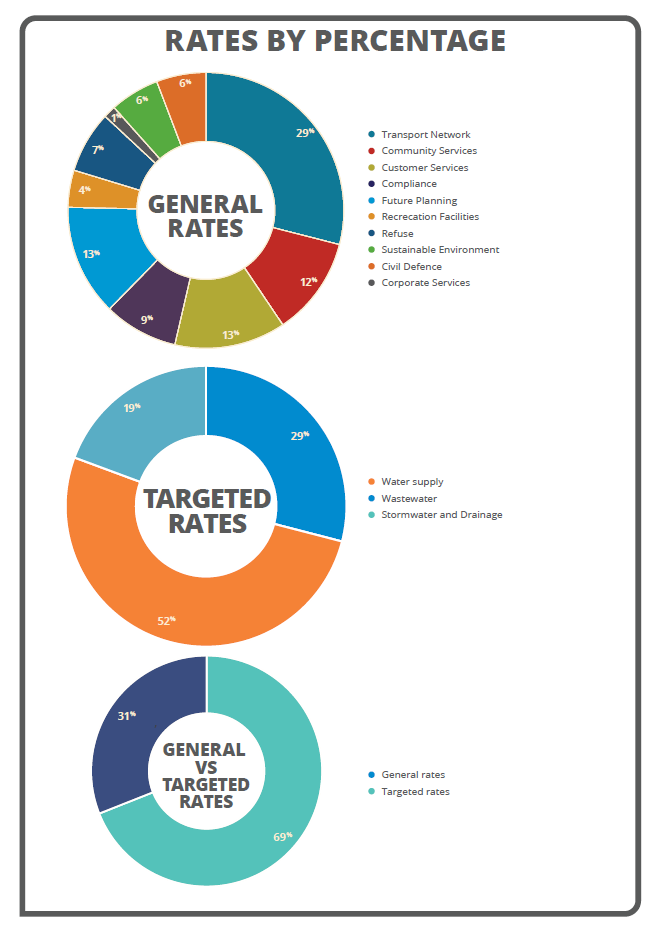
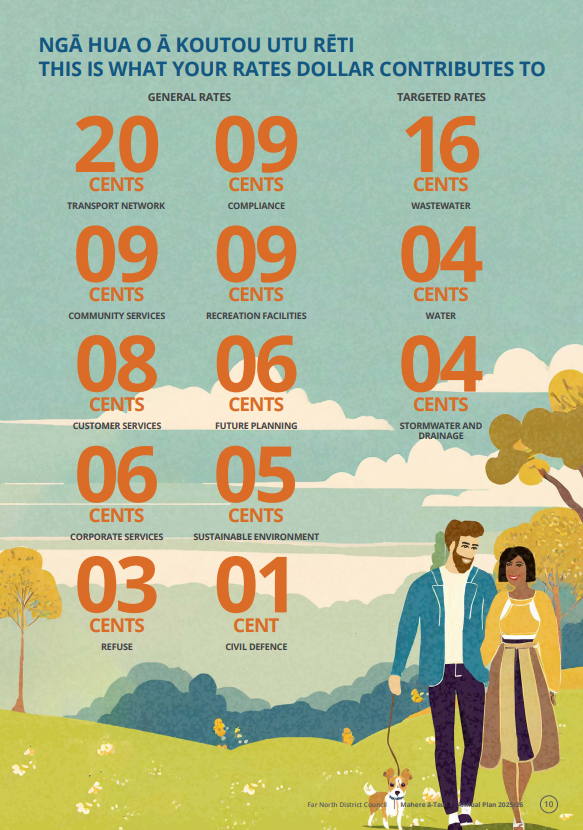
The graphics below outline how your rates are allocated.
An operating expenditure of $204.5 million is included in Annual Plan 2025/26.
- 42 per cent of this is paid for by government subsides and other income (e.g. dividends from Far North Holdings Limited).
- 58 per cent is paid for through the council’s general, targeted, ward, water, and stormwater rates, as well as fees and charges.
The $204.5 million of operating expenditure pays for:
- contractors to maintain our parks, reserves, public toilets, waste management and recycling, the Hokianga Ferry, transport safety programmes and road maintenance work
- council services such as compliance, animal management, community and customer services, planning and Civil Defence.
The council's asset base, worth $3.1 billion, includes:
- 73 community buildings
- 19 community halls
- 6 libraries and a mobile library
- 142 public toilets
- 31 wharfs and jetties
- 27 boat ramps
- 500 hectares of parks and reserves across 30 locations
- 11 cemeteries
- 28 playgrounds
- 12 community recycling centres
- 16 wastewater treatment plants
- 11 water treatment plants
- 2507 kms of roads (908 kms sealed / 1598 km unsealed)
- 550 bridges
- 234 kms of footpaths.