Emissions
What are Council's emissions?
In 2019 Council commissioned a carbon footprint analysis to measure the amount of greenhouse gases that are emitted by council operations annually.
That analysis identified 6,241 metric tonnes of carbon dioxide equivalent greenhouse gasses. Below is a summary of that analysis showing the areas where these emissions come from.
Source | tCO2e | % of Total |
Fuel | 442 | 7% |
Facilities | 55 | 1% |
Wastewater Treatment Plants | 3212* | 51% |
Landfill | 999 | 16% |
Electricity | 127 | 2% |
Wastewater Treatment Electricity | 147 | 2% |
Water Treatment Electricity | 116 | 2% |
Air Travel | 71 | 1% |
Commuting | 702 | 11% |
Waste Transfer | 370 | 7% |
Total | 6241 | 100% |
* Note that wastewater treatment plants emit greenhouse gases in the form of methane and nitrous oxide that are much strong greenhouse effect than carbon dioxide, but are shown in terms of carbon dioxide equivalent emissions.
How will Council reduce these emissions?
Council are developing an emissions reduction programme to look at all service areas and operations. Some examples include:
- Performance improvements at wastewater treatment plants
- More efficient vehicle fleet; optimised usage and reduced reliance on fossil fuels
- More efficient buildings; switch to LED lighting, optimising climate control, introduction of solar panels.
- Sending waste to landfills with methane digestors
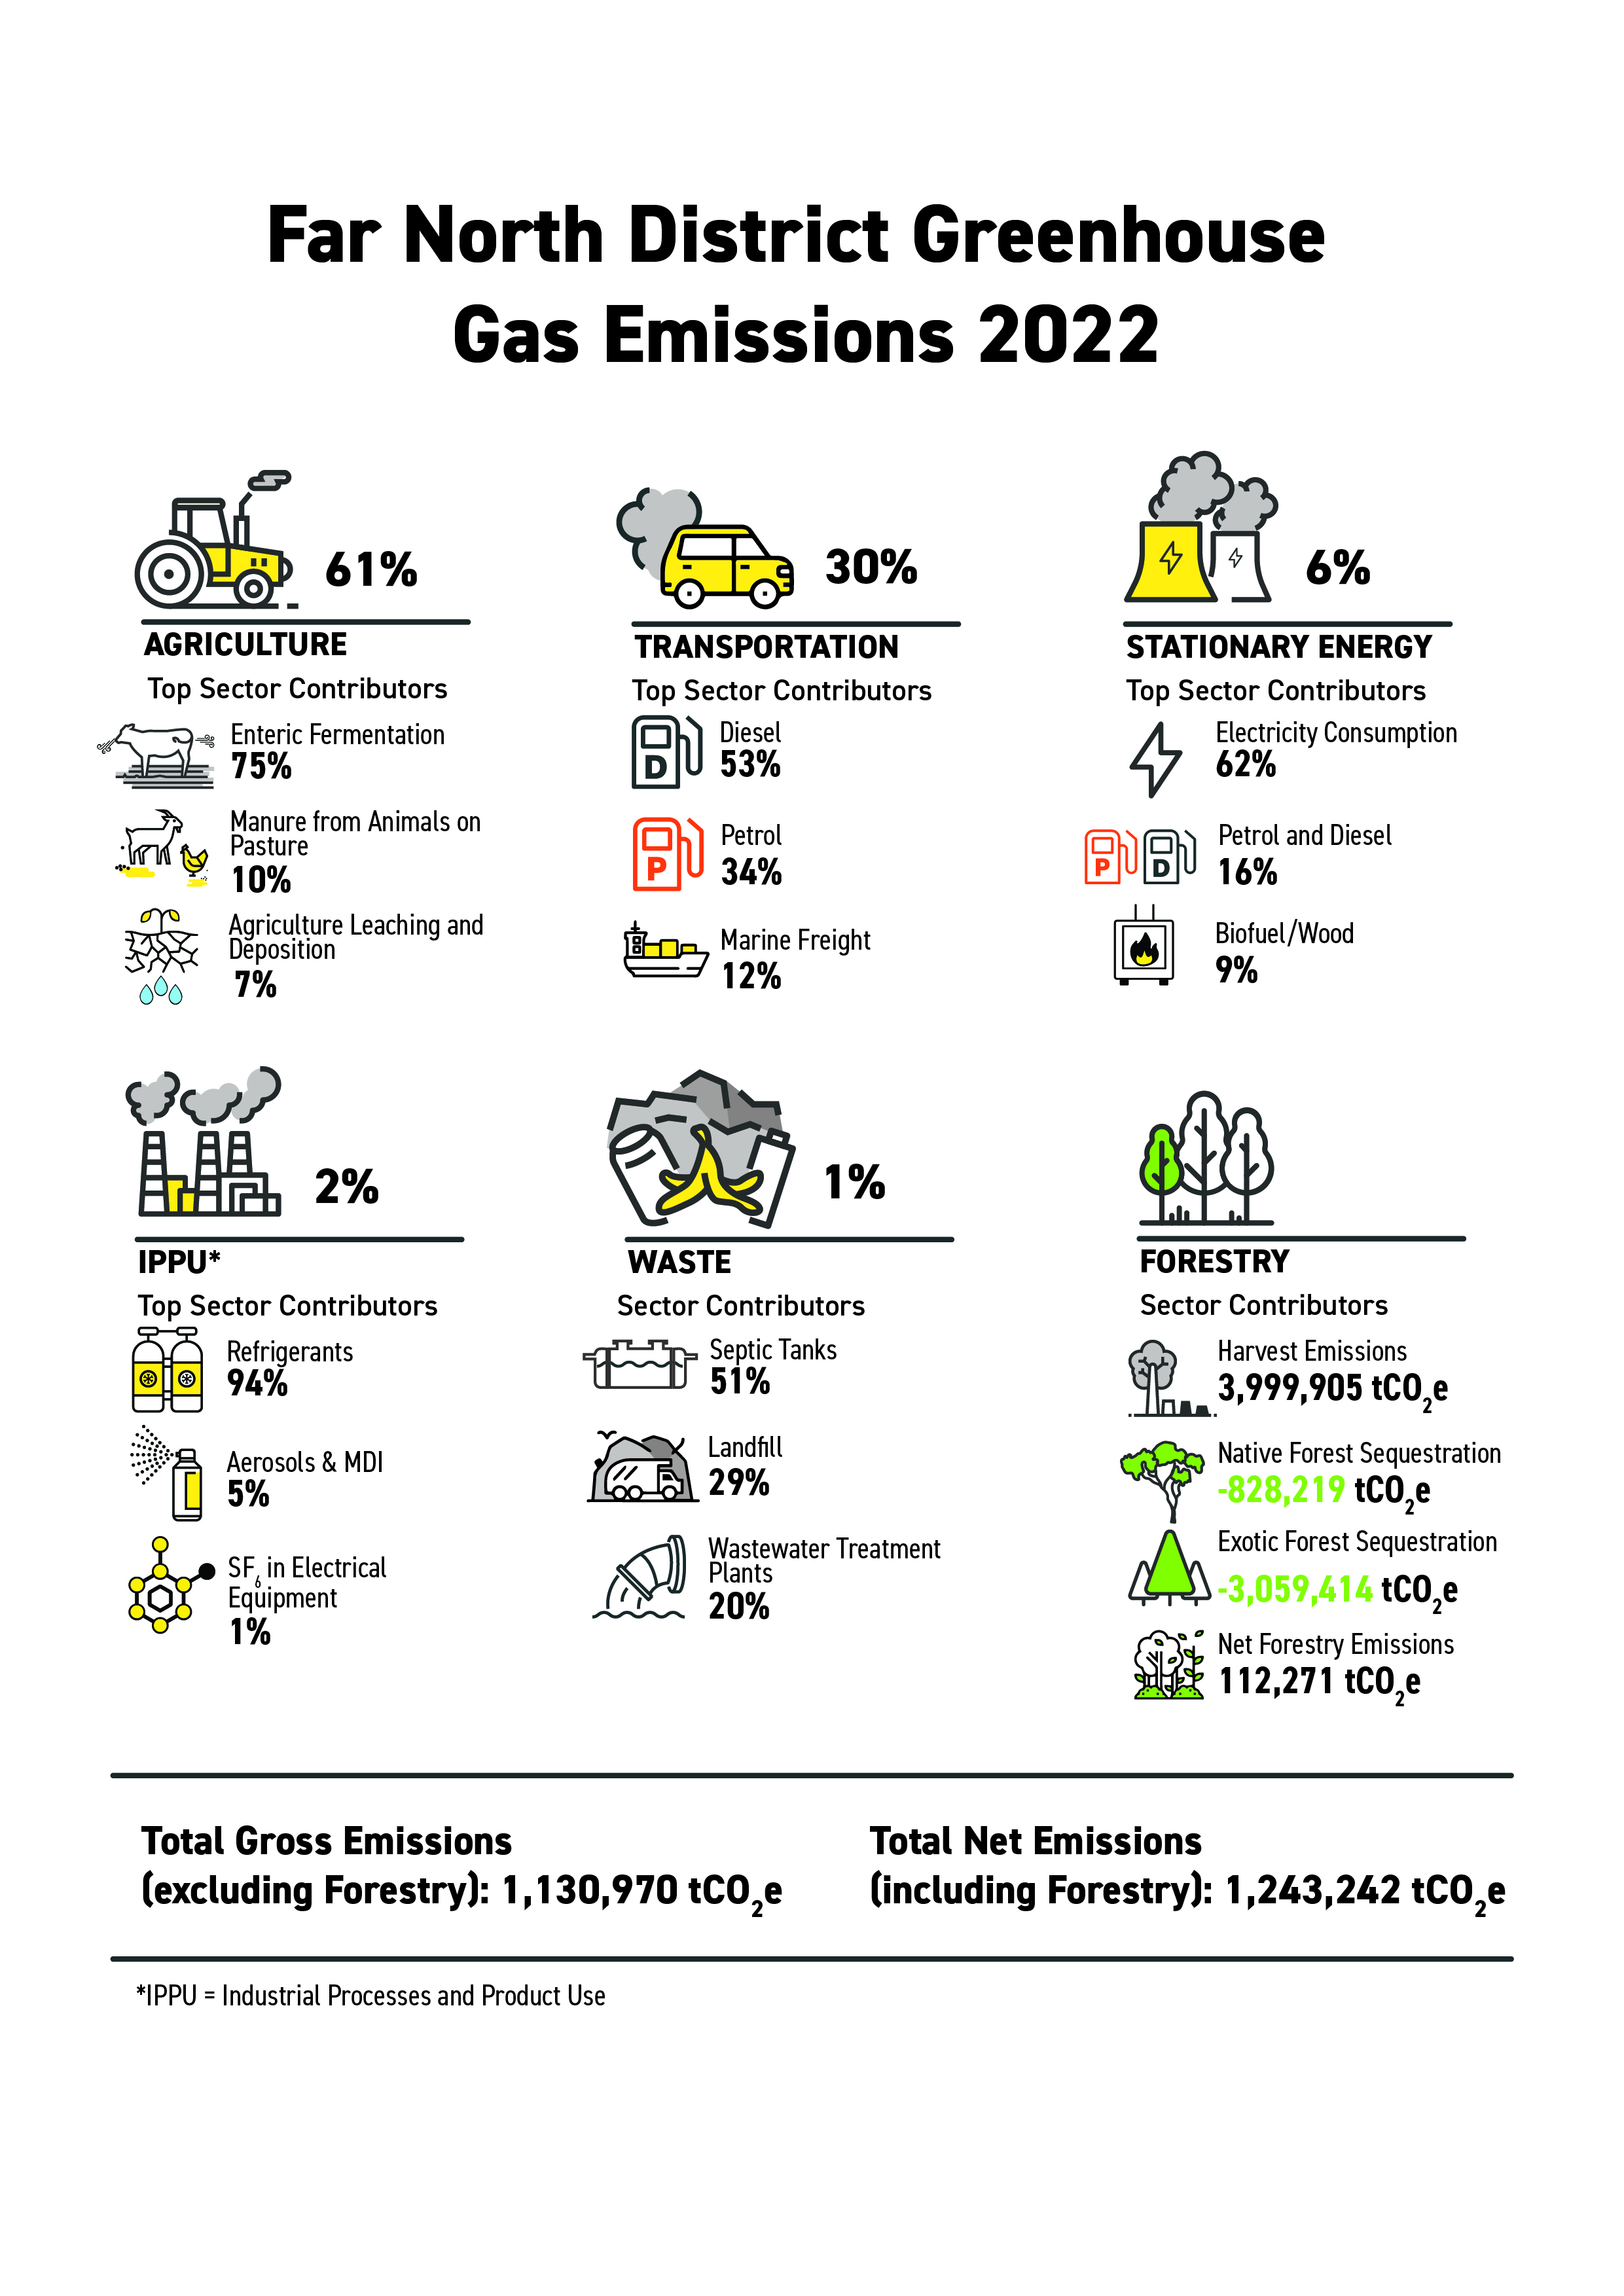
District-wide Emissions
Council has received a district wide emissions inventory report for the 2021-2022 financial year as part of a combined initiative with Te Tai Tokerau / Northland councils. The report details the Far North Districts Greenhouse Gas emissions resulting from activity and consumption. Read the Far North District Emissions Inventory.
The total gross emissions are 1,130,970 tCO2e. The graph below outlines the results with agriculture and transportation as the most significant contributors. Using information from the inventory, council can promote, monitor and support the community to reduce emissions.
Future audits
Council is currently working on an emissions audit for the 22-23FY. Council is working with Toitu Envirocare to achieve carbon zero certification in accordance with ISO 14064-1 and ISO 14067. Once completed, the data will be made public. This is anticipated to be completed by mid 2024.